
Viso Light Inspector capacity list
| Term | Symbol | Unit | Definition | Standards | Viso Capacity | Viso Data Extraction Keywords |
| Data presentation modes - All measurements are fundamentally radiometrical, and users can freely choose to have data presented in various modes | ||||||
| Photometric | Measurement of light in terms of what is perceived by the human eye (default: absolute photometry. Relative photometry mode available). | CIE 121, CIE S 025, LM-79, EN 13032-4, IEC 62722-1 ED2, IEC 62722-2-1 ED2 | Default output in lumen (lm) and candela (cd) | |||
| Horticultural | PAR photosynthetic active radiation | PAR region (400-700 nm) output in PPF (mmol/s) and PPFD | ||||
| Radiometric | All physical radiation (in a given wavelength range) | Radiated power output in W and W/sr | ||||
| Dose units (radiometric) | All physical radiation (in a given wavelength range combined with specific exposure input) | Radiated power output in W and W/sr and specific exposure time (hh:mm) | ||||
| Measurement ranges | ||||||
| Spectrometer ranges | Viso standard software supports all measurement ranges. | Viso BaseSensor/ LabSensor: VIS 360 – 830 nm UV-VIS 200 – 850 nm UV-VIS-NIR 200 – 1100 nm VIS-NIR 360 – 1100 nm LightSpion VIS: 360 – 830 nm |
||||
| Intensity range | The intensity range is governed both by the sensitivity of the sensor and the measurement distance. For small and weak light sources a short sensor distance is recommended | Viso BaseSpion - 25 mcd @0.35m to 2,000,000 cd @4.5m Viso LabSpion- 0.2 cd @1m to 80,000,000 cd @20m |
||||
| C-axis rotation range | The Viso automatic c-plane resolution setting sets the necessary qty of c-planes automatically by starting the measurement with a pre-measurement that determines the assymmetry of the light distribution. Full manual control is also an option. | 0°~+360°, automatic 4 to 72 c-planes, manual up to 360 c-planes | ||||
| Gamma axis rotation range | The Viso automatic gamma resolution setting determines the necessary resolution automatically. It starts out in 5° steps, and then reduces this resolution if necessary - but only in the beam section to save time. Full manual control is also an option. | Viso BaseSpion and LabSpion =
Automatic gamma rotation range: -180° to +180°, Manual resolution 0.1° to 5°. Automatic resolution 0.01° to 5°. Viso LightSpion = Automatic gamma rotation range: -180° to +180°, Manual resolution 1° to 5°. Automatic resolution 1° to 5°. |
||||
| Measurement range of luminous flux (Lambertian distribution) | Viso BaseSpion - 0.08 lm @1m – 12,700,000 lm @10m max. +/- 4% Viso LabSpion - 0.63 lm @1m – 63,000,000 @10m max. +/- 4% |
|||||
| Built-in AC power analyzer voltage range | AC: The system includes an AC power outlet to the DUT. The system can be supplemented with a more advanced external AC power supply (Viso LabPower combined power supply and power analyser) and other AC power supplies and power analyser. DC: In parallel, the system can be supplemented with any DC supply, and USB communication can be established. | 90 VAC - 260 VAC <+/- 0.5V | ||||
| Built-in AC power analyzer current range | 0 – 3 A (Avg: +/- 0.5 mA) | |||||
| Built-in AC power analyzer power range | 0 – 300 W (Avg: +/- 0.1 W) | |||||
| Built-in AC power analyzer sample rate | 70,000 samples/sec | |||||
| Basic photometrical data | ||||||
| Luminous intensity | I | cd (= lm/sr) | Density of luminous flux with respect to solid angle in a specified direction | CIE S 017:2011 | Yes | {INT#} and {RINT#} |
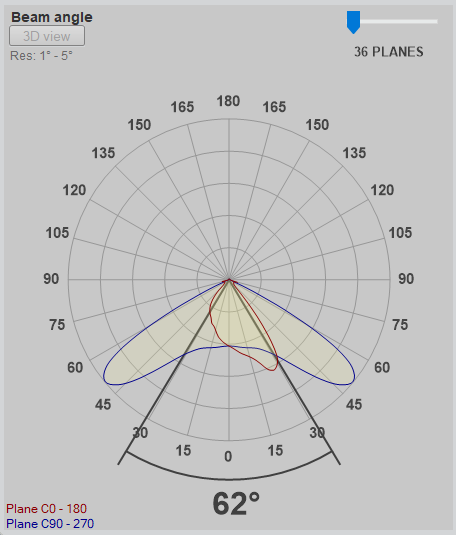
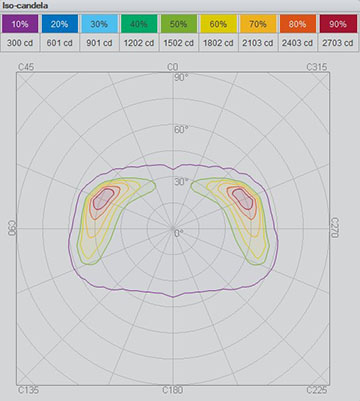
| Luminous intensity distribution | cd | Presentation, by means of curves or tables, of the values of the luminous intensity of a source as a function of direction in space
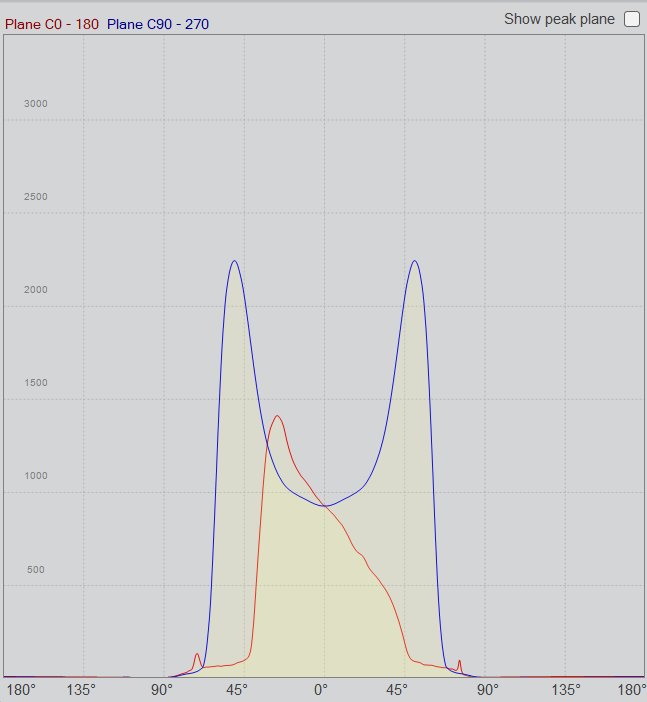 |
Yes - tables, polar curves, linear distribution, 3D and iso-candela diagrams. Output as IES files, LDT files, TM33 (XML) files 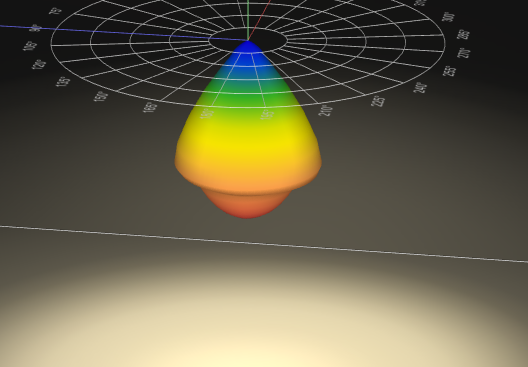 |
|||
| Luminous flux | Φ | lm | Luminous flux is the energy measurement of visible light treleased by a source of light. | CIE S 017:2011 | Yes | {LUM#} |
| Relative photometry efficiency | η | % | The difference between the measured light source lumen and the lumen of the naked light source used in the lighting fixture. | Yes | {REL_EFF} and {SOURCE_LUM} | |
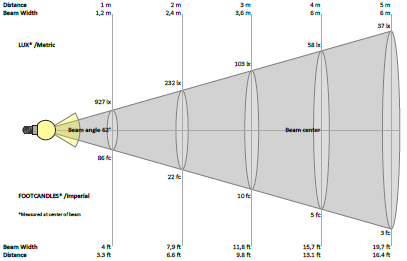
| Beam angle | degrees (°) | Angle between two imaginary lines in a plane through the optical beam axis, such that these lines pass through the centre of the front face of the device and through points at which the luminous intensity is 50% of the centre beam intensity | Yes | {B_ANG#} | ||
| Field angle (beam spread) | degree (°) | The angle between the two directions for which the intensity is 10% of the maximum intensity as measured in a plane through the nominal beam centerline | Yes | {F_ANG#} | ||
| Cutoff angle | degrees (°) | The angle between the two directions for which the intensity is 2,5% of the maximum intensity as measured in a plane through the nominal beam centerline | yes | {C_ANG#} | ||
| Uplight / Downlight | % | Luminous flux in the upper/lower hemisphere + up/down flux fractions | Yes | {LUM_UP} / {LUM_DOWN} {UFF} / {DFF} |
||
| Illuminance distribution | E | lux (=lm/m2) fc (=lm/ft2) |
Presentation, by means of curves or tables, of the density of incident luminous flux with respect to area at a point on a real or imaginary surface
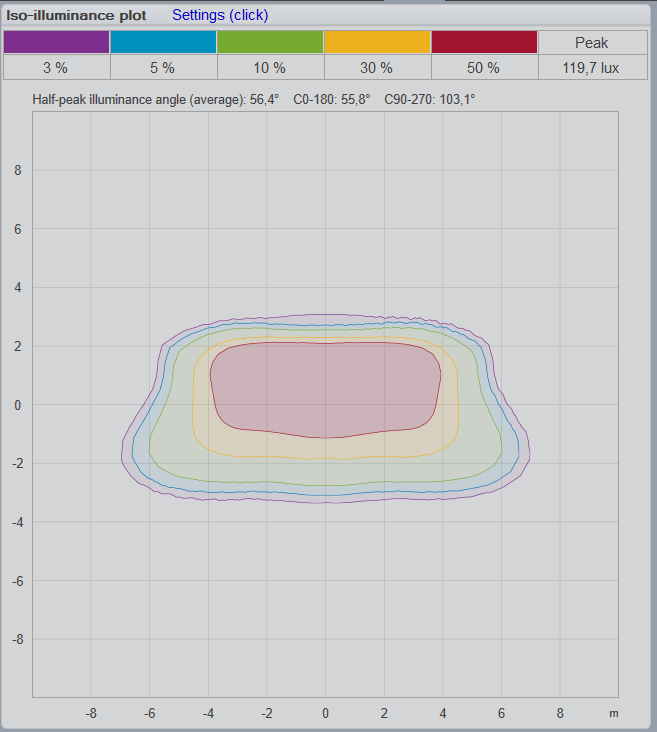  |
Yes - tables and iso-lux/footcandle diagrams | ||
| Half illuminance angle(s) | degrees (°) | The angle where the illuminance is half the peak illuminance on a plane perperdicular to the gamma 0 direction | {HALFILLUMANG} average, {HALFILLUMANGC0} plane c0-180 , {HALFILLUMANGC90} plane c90-270 | |||
| Beam distance | m | The distance in front of the lamp where is illuminance has dropped to 0.25 lux | Yes | {BEAMDISTL_M} | ||
| Beam width | m or ft | Beam width in m or ft from the lamp | Yes | {BW_M#} / {BW_F#} | ||
| Peak plane | degrees (°) | The c-plane that contains the maximum intensity (cd) measured | Yes | {PEAK} and {PEAKPLANETEXT} | ||
| BUG rating | Backlight-Uplight-Glare rating | IESNA TM-15-11 | Yes - BUG graphics and data 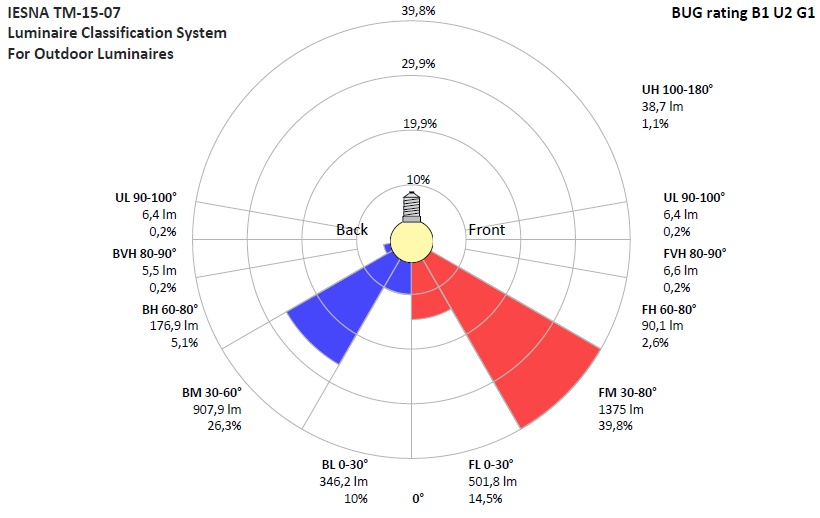 |
{BUG#} | ||
| Derived photometrical data | ||||||
| UGR tables | Unified Glare Rating (UGR) | CIE 117:1995 (Uncorrected, comprehensive, S/H=0.25) | Yes | |||
| Utilization factors | Quotient of the luminous flux received by a reference surface and the sum of the rated individual luminous fluxes of the lamps of the installation | Yes - special utilization factor graphics, also JP version 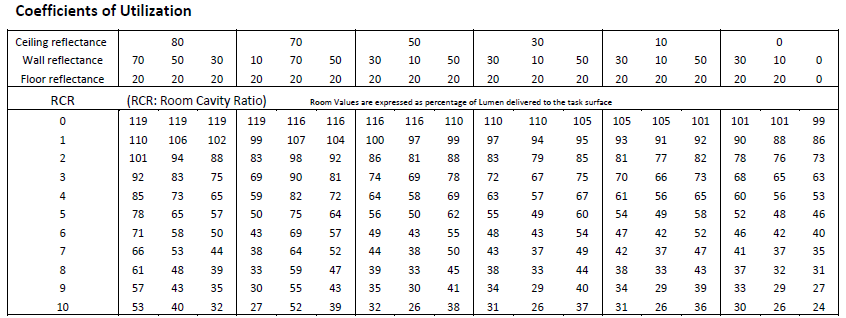 |
||||
| Luminaire budgetary diagram | Budget for qty of luminaires as a function of indoor space area and reflectance values. | Yes - special luminaire budgetary diagram 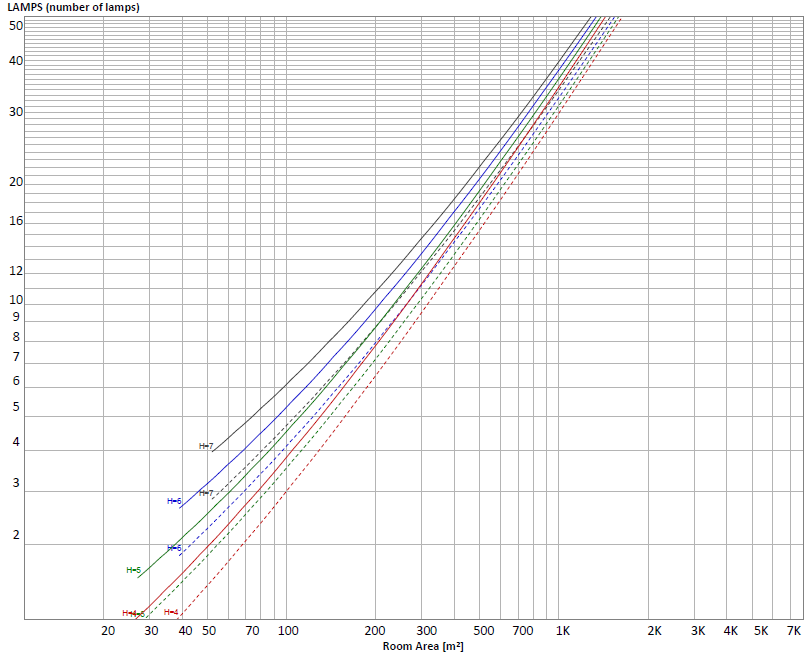 |
||||
| NITS (for uniform luminance distributions only) | nt (= 1 cd/m2) | Nits are a unit of measurement used to quantify the brightness of electronic displays, particularly those with emissive technologies like LEDs, OLEDs, and microLEDs. One nit is equivalent to one candela per square meter (cd/m²) | Yes | |||
| EU Ecodesign directionality | Yes - returns DLS = Directional Light Source and NDLS = Non Directional Light Source | {EU_DIR} | ||||
| CIE Flux code | CIE Luminaire classification system | EN 13032-2 AND CIE 040-1978 | Yes - via custom PDF reports | |||
| EN G* class | EU outdoor glare classification system | EN 13201-2 G* class | Yes - via custom PDF reports | |||
| Dark sky compliance | Test for US dark sky association luminaire compliance | Yes - via custom PDF reports | ||||
| EU Ecodesign Useful Luminous Flux | lm | Yes | {EU_USEFUL} | |||
| Derived human circadian light response data | ||||||
| Melanopic EDI lux | Melanopic Equivalent Daylight Illuminance | CIE 026 a-opic Toolbox - v.1.049a - 2020/11 | Yes - for a given angle and distance | {MEDILX#} (and {PHOLX#}) | ||
| MP Ratios | M/P 1 - M/P 2 - M/P 3 (Standard WELL v2-2019) - M/P 4 (Recommended by CIE S026-2018) | CIE S 026:2018 | Yes - via custom PDF reports | |||
| Melanopic action factor | The melanopic action factor is the ratio of melanopic irradiance to photopic irradiance | CIE S 026:2018 | Yes - for a given angle and distance | {MELA_ACTION_FACTOR#} | ||
| Human retinal photopigment complement | Melanopic (melanopsin), Rhodopic (rods), Cyanopic (s cone), Chloropic (M cone), Erythropic (L cone) | Yes - via custom PDF reports | ||||
| Special spectral response data | E.g., scotopic light, S/P ratios, mesopic light, | |||||
| COI | Cyanosis observation index | AS/NZS 1680.2.5 | Yes - via custom PDF reports | |||
| Spectral G-index | Protection for astronomical or ecological reasons | Yes - via custom PDF reports | ||||
| Basic radiometric data | ||||||
| Radiant intensity | I | W/sr | Density of radiant flux with respect to solid angle in a specified direction | Yes | ||
| Peak irradiance (@ 1 m) | ||||||
| Radiant Intensity distribution | Presentation, by means of curves or tables, of the values of the radiant intensity of a source as a function of direction in space | Yes | ||||
| Radiant flux | P | W | Radiant flux is the energy measurement of total electromagnetic energy treleased by a source of light. | Yes | ||
| Basic horticultural data | ||||||
| PPF - photosynthetic photon flux 400-700 nm | µmol/s | Total photon flux | Yes | {PPF#} | ||
| PPFD - photosynthetic photon flux density 400-700 | µmol/(m2·s) | Peak photon irradiance at peak at one meter distance. PPFD is measured in micromoles per square metre per second (µmol/m2/S) which establishes exactly how many PAR photons are landing on a specific area | Yes | {PPFD}, {PPFD_F#} (specific distance in ft), {PPFD_M#} (specific distance in m) | ||
| PPFW - photon efficiency | µmol/J | Photon efficiency in µmol per Joule | Yes | {PPFW} | ||
| DLI - Daily light integral | µmol/(m2·day) | DLI measures the sum of photosynthetic light (light in PAR range, 400-700nm) that plants receive over the course of a full day (a 24-hour period) | Yes | {DLI} | ||
| Photosynthetic photon flux for the whole spectrum | µmol/s | Total photon flux for the integrated spectrum (or a specific range) | Yes | {PFLUX#} | ||
| Color data | ||||||
| Spectral power distribution (SPD) | W/nm | Radiated power per wavelength | Yes - per measurement point or full light source (=integrated spectrum) - including graphics 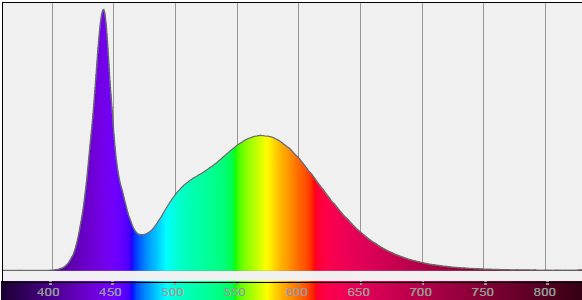 |
{PNM} and {PERNM} (the percentage over light in a given wave | ||
| Peak(s) in spectral power distribution | nm | Wavelength per peak no. | Yes - numbered peaks | {PEAK#} | ||
| Dominant wavelength | nm | Yes | {DNM} | |||
| Correlated color temperature (CCT) | T | K | Temperature of a Planckian radiator having the chromaticity nearest the chromaticity associated with the given spectral distribution on a modified 1976 UCS diagram where u′, are the coordinates of the Planckian locus and the test stimulus | Yes - per measurement point or full light source (=integrated CCT) | {CCT} and {RCCT} | |
| Color Rendering Index (CRI) | Measure of the degree to which the psychophysical colour of an object illuminated by the test illuminant conforms to that of the same object illuminated by the reference illuminant | CIE 13 | Yes - Specific values avaible too (R1 through R14) and graphics 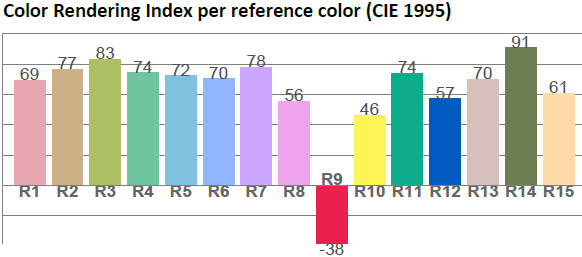 |
{R} and {R#} (14 specific values) | ||
| CQS (Color Quality Scale) | NIST Color quality system | Yes - including graphics 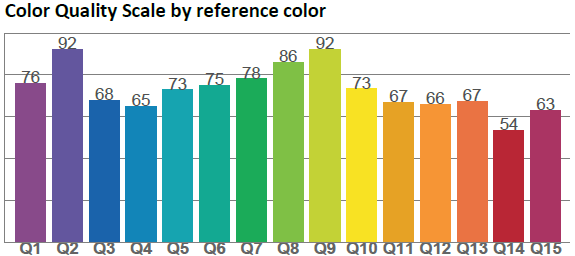 |
{Q#} | |||
| Television lighting consistency index 2012 | TLCI | A single averaged score up to 100 that is determined by the color response that would result when using a video camera. | ANSI/IES TM-30-18 | Yes - including graphics | ||
| Spectral Similarity Index | SSI | Spectral Similarity Index (SSI), Calculated according to the Society of Motion Picture and Television Engineers: SMPTE standard | ST 2122:2020 – Spectral Similarity Index (SSI)” | Yes - via special PDF report | ||
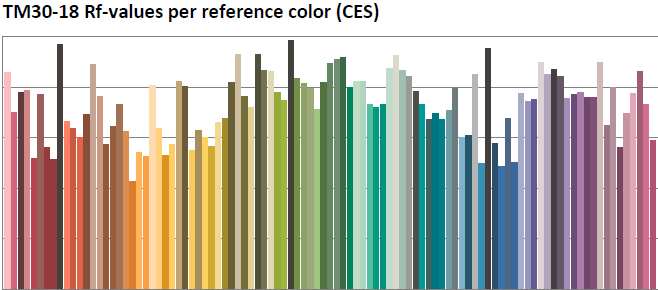
| ANSI/IES TM-30-18 Color Fidelity | Rf | Color Fidelity: Enumerates the accuracy with which the color appearance of surfaces and objects under a given test source match their appearance under a reference illuminant. | ANSI/IES TM-30-18 | Yes - including graphics 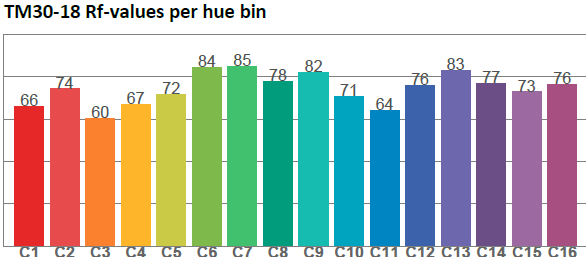
| {TM3} and {C#} (99 specific values) | |
| ANSI/IES TM-30-18 Color Gamut | Rg | Color Gamut: Enumerates the average increase or decrease of the chroma of surfaces and objects when viewed under a given test source relative to when viewed under a reference illuminant. | ANSI/IES TM-30-18 | Yes | {TM3g} | |
| ANSI/IES TM-30-18 Color Graphics |
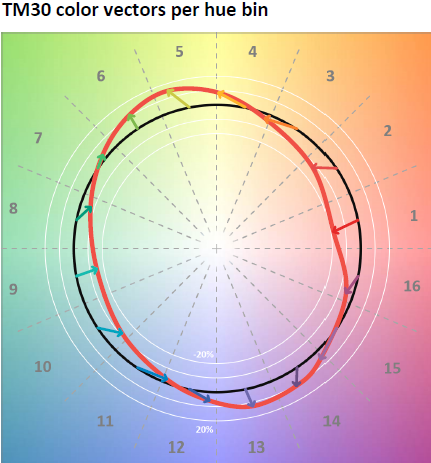  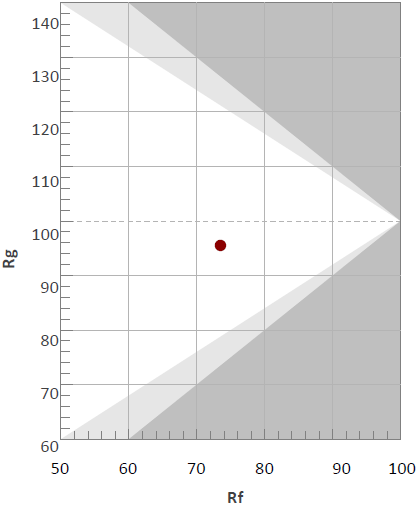 |
ANSI/IES TM-30-18 | Yes - Color vector graphics, color distortion graphics, Rf by Hue, Chroma shift by hue, and Rf/Rg plot | |||
| ANSI/IES TM-30-18 Special output | ANSI/IES TM-30-18 | Yes | {TM3fh1} Rf,h1 value; {TM3csh1} Rcs,h1 value; {TM3P} Design intent Preference; {TM3V} Design intent vividness, {TM3F} Design intent fidelity | |||
| MacAdam Ellipses | SDCM | ANSI C78-376 | Yes - including ANSI C78-376 Ellipses, and CIExy graphics 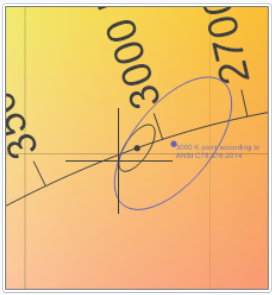 |
{SDCM}, {SDCM_ANSI} | ||
| Color deviation from BBL | CIE TN 001:2014 | Yes - via special PDF report | ||||
| Duv (chromaticity metric) | Closest distance from the Planckian locus on the (u', 2/3 v') diagram, with + sign for above and - sign for below the Planckian locus. | ANSI C78.377-2008 | Yes - per measurement point or full light source | {DUV} and {DuvMarkLinDist#} | ||
| CIE 1931 Color coordinates x,y | Yes - including graphics 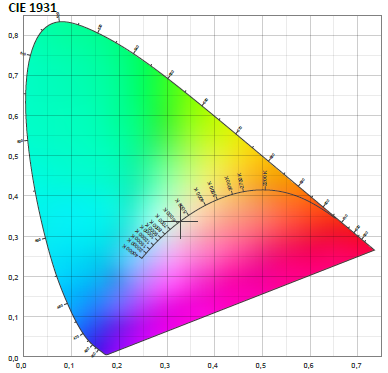 |
{CIEx#}, {CIEy#}, {RCIEx#}, {RCIEy#} | ||||
| CIE 1960 Color coordinates u,v | CIE ISO 11664-5:2024 | Yes | {CIEu#}, {CIEv#}, {RCIEu#}, {RCIEv#} | |||
| CIE 1976 Color coordinates u',v' | CIE 015:2004 | Yes | {CIEuMARK#}, {CIEvMARK#}, {RCIEuMARK#}, {RCIEvMARK#} | |||
| Power and efficacy data (obtained with built-in power analyzer, sampling rate 70,000 samples/s) | ||||||
| Power consumption | P | Yes Range 0 – 300 W (Avg: +/- 0.1 W) |
{PWR} | |||
| Voltage | U | V | Yes Range 90 VAC - 260 VAC max. +/- 0.5V |
{VOL} | ||
| Current | I | A | Yes Range 0 – 3 A (Avg: +/- 0.5 mA) |
{CUR} | ||
| Frequency | Hz | Yes | {FREQ} | |||
| Power factor | Yes | {PF} | ||||
| Displacement factor | Yes | {DPF} | ||||
| Luminous efficacy | lm/W | CIE S 017:2011 | Yes | {LPW} | ||
| Radiant efficacy | W/W | CIE S 017:2011 | {LPW} | |||
| Total harmonic distortion | For current and voltage |
Yes- including graphics 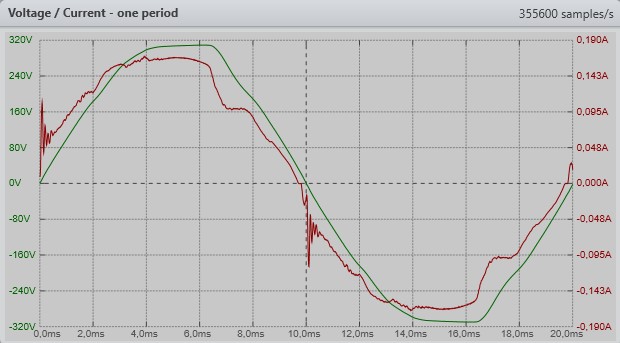 |
{THDC} and {THDV} | |||
| EU Ecodesign energy class | Yes - Returns A,B,C, etc | {EU_ECLASS} | ||||
| Power and efficacy data (obtained with Viso LabAnalyzer, sample rate 2,000,000 samples/s) | ||||||
| Power consumption | P | CIE S 025/ IES LM-79 /EN 13032-4 | Yes Power range AC 0.05W to 1700W @ 240VAC / 850W @ 120 VAC Power range DC 0.05W to 1700W @ 240VDC / 850W @ 120 VDC / 170W @ 24VDC / 85W @ 12VDC (50/60 Hz +/- 0.5%) |
{PWR} | ||
| Voltage | U | V | CIE S 025/ IES LM-79 /EN 13032-4 | Yes Range 0 - 826 V max. +/- 0.2% of reading+0.2% of range |
{VOL} | |
| Current | I | A | CIE S 025/ IES LM-79 /EN 13032-4 | Yes Range 3 mA – 16.5 A (max. 0.3% of reading + 0.3% of range) |
{CUR} | |
| Frequency | Hz | Yes Range 0-100 kHz |
{FREQ} | |||
| Power factor | Yes | {PF} | ||||
| Displacement factor | Yes | {DPF} | ||||
| Flicker data (obtained with the Viso LabFlicker accessory) | ||||||
| Percent flicker = Modulation depth | CIE TN 006:2016. | Yes | {FLP} | |||
| Flicker Index | CIE S 017:2020, 17-22-094 (CIE 2020) | Yes | {FLI} | |||
| Flicker frequency | Yes | {FLF} | ||||
| SVM (Stroboscopic visibility measure) | MVS | CIE TN 006:2016 and IEC TR 63158:2018 | Yes | {FLS} | ||
| PstLM (visible flicker) | Pst | IEC TR 61547-1:2020 | Yes | {FLPSTLM} | ||
| Flicker Mp value | A flicker perception metric recommended by ASSIST (Alliance for Solid-State Illumination Systems and Technologies, US) | ASSIST vol. 11, Issue 3, 2015 | Yes | {FLMP} | ||
| Flicker sample rate | F | Hz | Yes | {FL_SAMPLE_RATE} | ||
| JA8/JA10 | Test method described by California energy commission in title 24: Percent amplitude modulation at 40 Hz, 90 Hz, 200 Hz, 400 HZ, and 1000 Hz | California Energy Commission (CEC) 2016b | Yes | {FL_CO40}, {FL_CO90}, {FL_CO200}, {FL_CO400}, {FL_CO1000} | ||
| Flicker waveform and harmonics | 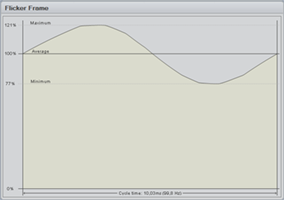 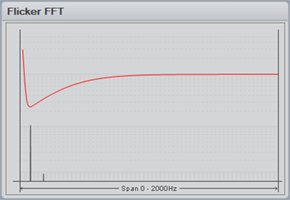 |
Yes - including graphics | ||||
| IEEE 1789 frequency modulation plot | 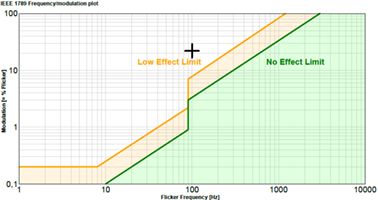 |
Yes - via special PDF reports | ||||